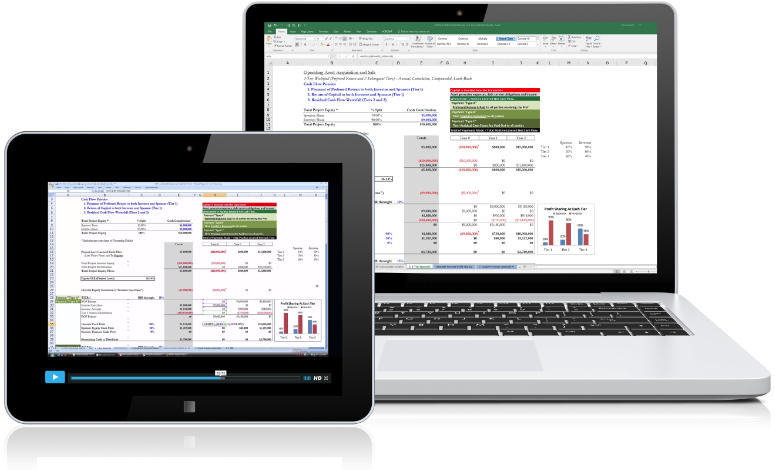
What it is
A self-study module that can make you more knowledgeable and skilled, improving your in-class performance and competitiveness as a job applicant.
This self-study module gives you:
Online access to 570+ minutes of easily-navigated video instruction, playable on any device including PC, Mac, phones and tablets
Accompanying fully-unlocked Excel files, compatible with both PC and Mac
Product Contents
Mixed-Use Apartment/Multi-Family Building Development Modeling

In this 180-minute video tutorial, you will learn how to model the speculative development and sale of a multi-family rental building with ground-floor retail and income-producing parking.
Topics covered include:
Site and Building Information Calculations
- Allowable density using FAR multiple and site area
- Allowable building footprint using lot coverage ratio and site area
- Building height using slab-to-slab height and story count
- Apartment gross square footage given an assumed ground-floor retail square footage
- Apartment rentable square footage given an efficiency factor
- Parking requirements and required parking gross square footage given usable square footage loss factor
Apartment Unit and Mix Detail Calculations
- Average rent/month given a monthly rent per square foot and average unit size
- Total rentable square feet of each unit type and total number of each unit type given average unit sizes, and percentage of total rentable square footage that each unit type comprises
- Monthly revenues and share of revenues by unit type
Capital Structure Calculations
- Sources of funds supplied by each of three equity sources, a mezzanine lender, and a senior lender
- Percentage of total development cost that each of the three equity investments comprise
Project Timing Elements
Understanding of the relationship between the durations of the three phases of development (Pre-Construction, Construction and Post-Construction), and the timing and dependencies of the major milestones within each of those phases
Uses of Funds
Quantification and timing of:
- Land and Acquisition Costs
- Hard Costs (based off of a bell-shaped distribution curve) and Tenant Improvement Costs
- Soft Costs
- Fixtures, Furnishings and Equipment Costs
- Financing Costs, including Capitalized Interest Expense, and Operating Deficit
Sources of Funds
Quantification and timing and interrelationship of Draws, Interest and Repayment, as applicable, of:
- Developer Sponsor Equity
- Developer Partner Equity
- Third Party Investor Equity
- Mezzanine Financing
- Senior Financing
Cash Flows and Returns Calculations
- Income and Expense Assumptions
- Apartment Unit Lease-Up Schedule
- Gross Rental Income, Effective Gross Revenue and Net Potential Revenue
- Total Operating Expenses and Real Estate Taxes
- Net Operating Income (NOI)
- Current Annual Yield
- Timing of Capital Expenditures
- Timing of Non-Capitalized Interest Expense
- Timing of Financing Cash Flows
- Project Levered Cash Flow
- Multiple on Equity
- Internal Rate of Return (IRR) on Equity
- Profit Margin
Capitalized Valuation Calculations
- “Current” Annual Net Operating Income
- Future Stabilized Net Operating Income
- Future Net Sale Amount
Profit Sharing/Internal Rate of Return Waterfalls
Calculation of profit sharing based on an assumed Internal Rate of Return Waterfall structure with preferred returns and promotes
Video 1 – Module Overview, Excel Settings, Footprint and Building
Video 2 – Unit Mix, Capital Structure, Conditional Statements
Videos 3a and 3b – Sources and Uses of Funds
Video 4 – Cash Flow and Returns Summary, NOI and Valuation
Video 5 – Profit Sharing, Waterfalls
Video 6 – Exhibits and Supporting Schedules
Video #1
– REFM Product Module Orientation
– Important Excel Settings
Tab: Apartment Module
– Apartment Module Introduction
Tab: FAR, Footprint and Massing
– FAR, Footprint & Massing Introduction
– FAR
– Lot Coverage
– Massing
Tab: Profile, Lot and Building Info.
– Profile, Lot & Building Info Tab Introduction
– Project Profile
– Lot & Above-Grade Building Description
– Below-Grade Parking Garage Description
Video #2
Tab: Apartment Unit and Mix Details
– Apartment Unit and Mix Details Introduction
– Table Overview
– Table Details
– Studios
Tab: Capital Structure 1
– Capital Structure 1 Tab
Tab: Capital Structure 2
– Capital Structure 2 Tab
Tab: Capital Structure 3
– Capital Structure 3 Tab
Tab: Capital Structure 4
– Capital Structure 4 Tab
Tab: Conditional Statements Introduction
– Conditional Statements Introduction Overview
– Control Panel
– Timeline Compression Discussion
– Pre-Construction Period
– Construction Start Month and Duration
– First C of O
– Construction End Month/Final C of O
– Post-Construction Leasing Duration
– Retail Tenant TI Payment
– Retail Tenant Rent Commencement
– Time Coding Overview
– Calendar Month
– Counting Numbers
– Construction Month #
– Construction Status
– Cell Reference Locking
– Calendar Year
– Development Fee Example
Video #3
Tab: Sources and Uses of Funds
– Sources and Uses Overview
– Land and Acquisition Costs
– Hard Costs Bell-Shaped Curve Description
Tab: Construction Bell-Shaped Curve
– Bell-Shaped Curve Tab
Tab: Sources and Uses of Funds
-Hard Costs Allocation
– Tenant Improvements
– Soft Costs
– Customizing Soft Costs
– FF&E Costs
– Financing Costs Overview
– Sources of Funds
– Equity Capital
– Sponsor Draw
– Partner Equity Draw
– Third Party Investor Draw
– Mezzanine Loan
– Senior Loan
– Financing Costs
Tab: Mezz Int Graph
– Capitalizing Interest
Tab: Mezz Int Graph – C v. Non-C
– Capitalizing Interest, continued
Tab: Sources and Uses of Funds
– Capitalizing Interest, continued
– Operating Deficit
– Checks on Sources & Uses
Video #4
Tab: Cash Flow and Returns Summary
– Cash Flow & Returns Summary Introduction
– Apt Rent Assumption
– Apt Operating Expenses Assumption
– Apt Real Estate Taxes Assumption
– Apt Rentable SF
– Apt Rent Concessions &
– Leasing Commissions Assumption
– Apt Vacancy Assumption
– Apt Parking Rent Assumption
– Apt Parking Vacancy Assumption
– Apt Credit & Collection Loss Assumption
– Apt Capitalization Rate
– Apt Selling Costs Assumption
– Retail Assumptions Overview
– Retail Rent Assumption
– Retail Operating Expense &
– Real Estate Tax Assumptions
– Retail Rentable SF
– Retail Vacancy Assumption
– Retail Capitalization Rate
– Retail Selling Costs
– Apt Units Leased
– Apt Cumulative Units Leased
– Apt Cumulative % Units Leased
– Apt Income
– Apt Amenity Fee/Misc. Income
– Parking Income
– Retail Net Operating Income
– Gross Rental Income
– Apt Rent Concessions & Leasing Commissions
– Apt Vacancy
– Parking Vacancy
– Credit & Collection Losses
– Effective Gross Revenue
– Apartments & Parking Sale, Net
Tab: Net Operating Income; Valuation
– Net Operating Income; Valuation Tab Overview
– “Current” Net Operating Income
– Future Stabilized NOI Overview
– “Current” Annual NOI Calculation
– Capital Expenditures
– “Current” Annual NOI After CapEx
– Inflation to Future NOI
– Future Stabilized Yield On Cost
– Future Capitalized Value
Tab: Cash Flow and Returns Summary
– Apartments & Parking Sale, Net
– Retail Condominium Sale
– Total Net Potential Revenue
– Operating Expenses
– Real Estate Taxes
– Net Operating Income (Net Revenue, or NOI)
– Current Annual Yield On Cost
– NOI After CapEx Overview
– Capital Expenditures
– NOI After Replacement Reserves
– Interest Expense
– Senior Loan Interest Expense
– Mezzanine Loan Interest Expense
– NOI After Interest
– Levering the Cash Flows
– Financing Cash Flows Overview
– Equity & Loan Draws
– Senior & Mezzanine Loan Repayment
– Operating Deficit
– Project Levered Cash Flow
– Net Levered Cash Flow
– Returns Summary Box
– Net Levered Cash Flow
– Equity Investment
– Multiple on Equity
– Internal Rate of Return (IRR) on Equity
– Total Development Cost
– Profit Margin
Video #5
Tab: Profit Sharing
– Profit Sharing Overview
– IRR Waterfall Structure Introduction
Tab: Waterfall #1 Graphs
– Waterfall #1 Overview
Tab: Waterfall #1
– Waterfall #1 Detail
– Waterfall #1 Structure Box
– Monthly Timeline
– Total Project Invested Equity
– Total Project Distributions
– Third Party Investor Equity Investment
– Inter-Tier Relationship
– Waterfall Animation
– Tier 1 IRR Range
– Beginning of Period Balance
– End of Period Balance
– Third Party Investor Injection
– Accrual of Returns Assumption
– Investor Accruals Assumption
– Tier 1 Accrual Distribution
– End of Period Balance
– Accrual Distribution Revisited
– Partitioning Tier 1 Cash Flows
– Investor Cash Flow
– Top-Level Developer Cash Flow
– Developer Promote Cash Flow
– Tier 1 Remaining Cash to Distribute
– Tier 2 Overview
– Investor Injections
– Investor Accruals
– Tier 1 Accrual Distribution
– Tier 2 Accrual Distribution
– End of Period Balance
– Investor Cash Flow
– Developer Equity Cash Flow
– Developer Promote Cash Flow
– Remaining Cash to Distribute
– Tiers 3 and 4
– Tier 5 Overview
– Cash Flow Calculation
– Discussion of Tier 5 Cash Flows
– Waterfall Logic Illustration
– Waterfall #1 Review
– Returns Summary Overview
– Project Level Returns
– Investor Returns
– Top-Level Developer Returns
– Cash Flow Check
– IRR Check
Tab: Profit Sharing
– Waterfall #2 Overview
Tab: Waterfall #2
– Waterfall #2 Calculation
– Difference Between Waterfall #1 and Waterfall #2
– Project Level Equity Flows
– Developer Gross Cash Flow
– Developer Partner Equity Investment
– Tier 1 Remaining Cash to Distribute
– Checking Waterfall #2
– Returns Summary
– Cash Flow Check
– IRR Check
Video #6
Tab: Sources and Uses Exhibit
– Sources and Uses Exhibit
Tab: Supporting Schedules
– Supporting Schedules Overview
Tab: Land & Acquisition Costs Schedule
– Land & Acquisition Costs Schedule
Tab: Hard Costs Budget Schedule
– Hard Costs Budget Schedule
Tab: Soft Costs Budget Schedule
– Soft Costs Budget Schedule
Tab: Operating Expenses Schedule
– Operating Expenses Schedule
Tab: Returns Exhibit
– Returns Exhibit
Tab: Transaction Summary
– Transaction Summary Exhibit
Mixed-Use Condominium Building Development Financial Modeling

In this 65-minute video tutorial, you will learn how to efficiently model the ground-up development of a residential condominium building with ground-floor retail and income-producing parking. Includes fully-assembled, fully-unlocked Excel file with 12 hands-on Tutorial exercises and accompanying solutions.
The Excel file includes the following tabs:
- Profile, Lot and Building Information
- Stacking Plan
- Sources and Uses Overview
- Cost Inputs & Capital Structure
- Sources and Uses – Exercise
- Sources and Uses – Solution
- Construction Bell-Shaped Curve
- Unit Mix and Pricing – Exercise
- Unit Mix and Pricing – Solution
- Cash Flow Overview
- Cash Flows – Exercise
- Cash Flows – Solution
What You Will Learn
A mastery of Excel-based technical financial projection modeling skills for the projection modeling of a mixed-use residential condominium building with ground-floor retail and income-producing parking. A strong emphasis is placed on leveraging the power of conditional (“If, Then”) statement formulas.
Topics covered include the modeling of:
- Site and building profile for above- and below-grade project elements
- Uses and Sources of Funds without creating potentially dangerous circular references
- Dynamic land purchase closing
- Dynamic base building hard costs allocation from a bell-shaped curve lookup table
- Modeling multiple retail tenants
- Three equity sources, mezzanine loan, and senior construction loan
- Weighted average unit pricing for Market, Pre-Sales and Affordable units
- Optimizing unit sizes to consume all available FAR
- Dynamic unit absorption for pre-sales and regular sales
- Sale of retail condominium unit
Video Tutorial Contents
- Introduction
- Profile, Lot & Building Information (7 mins)
- Stacking Plan (1 min)
- Sources & Uses Overview (2 mins)
- Cost Inputs & Capital Structure (Section)
- Circular References (2.5 min)
- Stating Equity and Mezzanine Dollar Amounts (1 min)
- Sources & Uses Exercise Tab (Section)
- Control Panel & Analysis Timeline (1 min)
- Certificate of Occupancy (C of O) (1.5 min)
- Retail Component Timing (40 sec)
- Dynamic Timeline (40 sec)
- Elapsed Month # (5 sec)
- Construction Month # (10 sec)
- Construction Status (15 sec)
- Uses of Funds (Section)
- Basic Setup & Customization (30 sec)
- Land & Acquisition Costs (20 sec)
- Exercise #1 (30 sec)
- Exercise #1 Solution (1 min)
- Hard Costs & Contingency and VLOOKUP Function (1.5 min)
- Construction Bell-Shape Curve Tab (3 min)
- Retail Tenant Improvements (TIs) (1 min)
- Exercise #2 (30 sec)
- Exercise #2 Solution (1.5 min)
- Soft Costs (1 min)
- Furnishings, Fixtures & Equipment (FF&E) (1 min)
- Subtotal Eligible Senior Loan Costs (15 sec)
- Financing Costs Overview (20 sec)
- Total Development Costs (20 sec)
- Sources of Funds (Section)
- Developer Sponsor Equity Direct Project Costs Draw (45 sec)
- Operating & Financing Deficits (30 sec)
- Developer Partner Equity Priority (10 sec)
- Developer Partner Equity Direct Project Costs Draw (40 sec)
- Third Party Investor Equity Priority (10 sec)
- Third Party Investor Direct Project Costs Draw (30 sec)
- Total Equity Investment (5 sec)
- Mezzanine Loan Overview (10 sec)
- Mezzanine Loan Direct Project Costs Draw (20 sec)
- Mezzanine Loan Origination Costs (10 sec)
- Mezzanine Loan Cash Interest Payments (10 sec
- Mezzanine Loan Repayment (1 min)
- Mezzanine Loan End of Period Balance (10 sec)
- Senior Loan Overview (5 sec)
- Senior Loan Direct Project Costs Draw (1.5 min)
- Senior Loan Fees (10 sec)
- Senior Loan Funded Interest Reserve and Cash Interest Payments (1.5 min)
- Senior Loan Repayment (20 sec)
- Senior Loan Ending Balance (10 sec)
- Property Cash Flow As Source Of Funds (1.5 min)
- Operating & Financing Deficits Combined (1 min)
- Interest Rate Sensitivity Analysis (Section)
- Resizing The Senior Loan With Goal Seek (2 min)
- Creating A Macro To Run Goal Seek (3 min)
- Exercise #3
- Exercise #3 Solution
- Unit Mix and Pricing Exercise Tab (Section)
- Exercises #4, 5, 6, 7 (30 sec)
- Exercises #4, 5, 6, 7 Solutions (1.5 min)
- Cash Flow Overview Tab (40 sec)
- Cash Flows Exercise Tab (Section)
- Cash Flow Assumptions (40 sec)
- Pre-Sales (20 sec)
- Regular Market Rate Units (20 sec)
- Affordable Units (20 sec)
- Exercise #8 (45 sec)
- Exercise #8 Solution (2.5 min)
- Parking and Storage Sales (15 sec)
- Revenues Overview (20 sec)
- Exercise #9 (20 sec)
- Exercise #9 Solution (20 sec)
- Retail Net Operating Income (NOI) (20 sec)
- Gross Revenue & Selling Costs (10 sec)
- Net Revenues (10 sec)
- Operating Expenses & Real Estate Taxes (30 sec)
- Exercise #10 (5 sec)
- Exercise #10 Solution (1.5 min)
- Exercise #11 (10 sec)
- Exercise #11 Solution (1 min)
- Net Revenue After Expenses and Retail Condominium Sale Before Financing Costs (15 sec)
- Unlevered Cash Flow (45 sec)
- Net Revenue Before Retail Sale After Financing Costs (15 sec)
- Exercise #12 (15 sec)
- Exercise #12 Solution (20 sec)
- Net Revenue After Retail Sale After Financing Costs (10 sec)
- Levered Cash Flow (45 sec)
- The Transaction Story Revisited (40 sec)
- Net Levered Cash Flow (Pre-Income Tax Profit) (10 sec)
- Investment Performance Metrics (10 sec)
Mixed-Use Office/Industrial Building Development Modeling

In this 180-minute video tutorial, you will learn how to model the speculative development and sale of a commercial (office or industrial) building (with a ground-floor retail component for office building) and income-producing parking component.
Topics covered include:
Site and Building Information Calculations
– Allowable density using FAR multiple and site area
– Allowable building footprint using lot coverage ratio and site area
– Building height using slab-to-slab height and story count
– Commercial gross square footage given an assumed ground-floor retail square footage
– Commercial rentable square footage given an efficiency factor
– Parking requirements and required parking gross square footage given usable square footage loss factor
Capital Structure
– Calculation of sources of funds supplied by each of three equity sources, a mezzanine lender, and a senior lender
– Calculation of percentage of total development cost that each of the three equity investments comprise
Project Timing Elements
– Understanding of the relationship between the durations of the three phases of development (Pre-Construction, Construction and Post-Construction), and the timing and dependencies of the major milestones within each of those phases
Uses of Funds
– Quantification and timing of:
– Land and Acquisition Costs
– Hard Costs (based off of a bell-shaped distribution curve) and Tenant Improvement Costs
– Soft Costs
– Fixtures, Furnishings and Equipment Costs
– Financing Costs, including Capitalized Interest Expense, and Operating Deficit
Sources of Funds
– Quantification and timing and interrelationship of Draws, Interest and Repayment, as applicable, of:
– Developer Sponsor Equity
– Developer Partner Equity
– Third Party Investor Equity
– Mezzanine Financing
– Senior Financing
Cash Flows and Returns Calculations
– Income, Expense and Capitalization Rate Assumptions
– Total Operating Income and Parking Total Operating Income and Vacancy
– Total Operating Expenses and Real Estate Taxes
– Net Operating Income (NOI)
– Current Annual Yield
– Timing of Non-Capitalized Interest Expense
– Timing of Financing Cash Flows
– Project Levered Cash Flow
– Multiple on Equity
– Internal Rate of Return (IRR) on Equity
– Profit Margin
Capitalized Valuation
– “Current” Annual Net Operating Income
– Future Stabilized Net Operating Income
– Future Net Sale Amount
Profit Sharing/Internal Rate of Return Waterfalls
– Calculation of profit sharing based on an assumed Internal Rate of Return Waterfall structure with preferred returns and promotes
Video #1 – Module Overview, Excel Settings, Footprint and Building
Video #2 – Capital Structure, Conditional Statements
Videos 3a and 3b – Sources and Uses of Funds
Video #4 – Cash Flow and Returns Summary, NOI and Valuation
Video #5 – Profit Sharing, Waterfalls
Video #6 – Exhibits and Supporting Schedules
Video #1
Module Overview, Excel Settings, Footprint and Building
– REFM Product Module Orientation
– Important Excel Settings
Tab: Office Industrial Module
– Office Industrial Module Introduction
Tab: FAR, Footprint and Massing
– FAR, Footprint & Massing Introduction
– FAR
– Lot Coverage
– Massing
Tab: Profile, Lot and Building Info.
– Profile, Lot & Building Info Tab Intro
– Project Profile
– Lot & Above-Grade Building Description
– Below-Grade Parking Garage Description
Video #2
Capital Structure, Conditional Statements
Tab: Capital Structure 1
– Capital Structure 1 Tab
Tab: Capital Structure 2
– Capital Structure 2 Tab
Tab: Capital Structure 3
– Capital Structure 3 Tab
Tab: Capital Structure 4
– Capital Structure 4 Tab
Tab: Conditional Statements Introduction
– Conditional Statements Introduction Overview
– Control Panel
– Timeline Compression Discussion
– Pre-Construction Period
– Construction Start Month and Duration
– Construction End Month/C of O Received
– Post-Construction Leasing Duration
– Office Tenant Rent Commencement
– Tenant Improvement Payments
– Disposition (Sale) of Office, Parking and Retail
– Retail Tenant Rent Commencement
– Time Coding Overview
– Calendar Month
– Counting Numbers
– Construction Month #
– Cell Reference Locking
– Construction Status
– Calendar Year
– Development Fee Example
Video #3a
Sources and Uses of Funds, Part 1
Tab: Sources and Uses of Funds
– Sources and Uses Overview
– Land and Acquisition Costs
– Hard Costs Bell-Shaped Curve Description
Tab: Construction Bell-Shaped Curve
– Bell-Shaped Curve Tab
Tab: Sources and Uses of Funds
– Hard Costs Allocation
– Tenant Improvements
– Soft Costs/Customizing Soft Costs
– FF&E Costs
– Financing Costs Overview
– Sources of Funds Introduction
– Equity Capital
– Equity Capital Relationships
– Developer Sponsor Equity
– Developer Sponsor Draw
– Developer Sponsor Cumulative Draw
– Developer Partner Equity Draw
Video #3b
Sources and Uses of Funds, Part 2
Tab: Sources and Uses of Funds
– Third Party Investor Draw
– Mezzanine Loan
– Senior Loan
– Financing Costs
Tab: Mezz Int Graph
– Capitalizing Interest
Tab: Mezz Int Graph – C v. Non-C
– Capitalizing Interest, continued
Tab: Sources and Uses of Funds
– Capitalizing Interest, continued
– Operating Deficit
– Total Financing Costs
– Total Development Costs
– Checks on Sources & Uses
Video #4
Cash Flow and Returns Summary, NOI and Valuation
Tab: Cash Flow and Returns Summary
– Cash Flow & Returns Summary Introduction
– Cash Flow Assumptions
– Ave. Rent PSF
– Discussion on Rent PSF Assumption
– Operating Expenses PSF
– Discussion on Operating Expense PSF Assumption
– Real Estate Taxes PSF
– Vacancy
– Capitalization Rate
– Selling Costs
– Retail Component Assumptions Introduction
– Rent PSF
– Operating Expenses and Real Estate Taxes PSF
– Vacancy
– Capitalization Rate
– Revenues Section
– Office Total Operating Income
– Office Vacancy
– Parking Total Operating Income
Tab: Parking Income Projection
– Parking Income Projection Tab
Tab: Cash Flow and Returns Summary
– Parking Income, continued
– Office Building and Parking Sale, Net Overview
Tab: Net Operating Income; Valuation
– Net Operating Income; Valuation Tab Overview
– “Current” Office and Parking Asset Annual NOI
– Stabilized NOI Rationale
– Gross Potential Annual Operating Income
– Vacancy Allowance
– Operating Expenses & RE Taxes
– Parking NOI
– “Current” Annual NOI and Yield on Cost
– Capital Expenditure Discussion
– Inflation Discussion
– Average Rent at Capitalization
– Future Stabilized NOI
– Future Stabilized Yield On Cost
– Capitalized Value
– Net Sale Amount
Tab: Cash Flow and Returns Summary
– Office and Parking Sale, Net
– Retail Net Operating Income
– Retail Vacancy
– Retail Condominium Sale, Net
– Total Potential Revenue
– Operating Expenses
– Real Estate Taxes
– Total Operating Expenses and RE Taxes
– Net Operating Income (NOI)
– Interest Expense
– Senior Loan Interest Expense
– Mezzanine Loan Interest Expense
– Total Interest Expense
– NOI After Interest
– Financing Cash Flows Overview
– Equity and Loan Draws
– Senior and Mezzanine Loan Repayment
– Operating Deficit
– Project Levered Cash Flow
– Net Levered Cash Flow
– Returns Summary Box
– Multiple on Equity
– Internal Rate of Return (IRR) on Equity
– Profit Margin
Video #5
Profit Sharing, Waterfalls
Tab: Profit Sharing
– Profit Sharing Overview
– IRR Waterfall Structure Introduction
Tab: Waterfall #1 Graphs
– Waterfall #1 Overview
Tab: Waterfall #1
– Waterfall #1 Detail Overview
– Waterfall #1 Structure Box
– Monthly Timeline
– Total Project Invested Equity
– Total Project Distributions
– Third Party Investor Equity Investment
– Inter-Tier Relationship
– Waterfall Animation
– Tier 1 IRR Range
– Beginning of Period Balance
– End of Period Balance
– Third Party Investor Injection
– Accrual of Returns Assumption
– Investor Accruals
– Tier 1 Accrual Distribution
– End of Period Balance
– Accrual Distribution Discussion
– Partitioning Tier 1 Cash Flows
– Investor Cash Flow
– Top-Level Developer Cash Flow
– Developer Promote Cash Flow
– Tier 1 Remaining Cash to Distribute
– Tier 2 Overview
– Investor Injections
– Investor Accruals
– Tier 1 Accrual Distribution
– Tier 2 Accrual Distribution
– End of Period Balance
– Investor Cash Flow
– Developer Equity Cash Flow
– Developer Promote Cash Flow
– Remaining Cash to Distribute
– Tiers 3 and 4
– Tier 5 Overview
– Cash Flow Calculation
– Discussion of Tier 5 Cash Flows
– Waterfall Logic Illustration
– Waterfall #1 Review
– Returns Summary Overview
– Project Level Returns
– Investor Returns
– Top-Level Developer Returns
– Cash Flow Check
– IRR Check
Tab: Profit Sharing
– Waterfall #2 Overview
Tab: Waterfall #2 Graphs
– Overview
– Tab: Waterfall #2
– Waterfall #2 Calculation Overview
– Differences Between Waterfalls #1 and #2
– Equity Split
– Project Level Equity Flows
– Developer Gross Cash Flow
– Developer Partner Equity Investment
– Tier 1 Remaining Cash to Distribute
– Checking Waterfall #2
– Returns Summary
– Cash Flow Check
– IRR Check
Video #6
Exhibits and Supporting Schedules
Tab: Sources and Uses Exhibit
– Sources and Uses Exhibit
Tab: Supporting Schedules
– Supporting Schedules Overview
Tab: Land & Acquisition Costs Schedule
– Land & Acquisition Costs Schedule
Tab: Hard Costs Budget Schedule
– Hard Costs Budget Schedule
Tab: Soft Costs Budget Schedule
– Soft Costs Budget Schedule
Tab: Operating Expenses Schedule
– Operating Expenses Schedule
Tab: Returns Exhibit
– Returns Exhibit
Tab: Transaction Summary
– Transaction Summary Exhibit
Apartment/Multi-Family Building Acquisition and Renovation Financial Modeling

In this 75-minute video tutorial, you will learn how to model the acquisition and individual unit renovation (with continued operation) of a multi-family rental building with ground-floor retail and income-producing parking. The principles and skills taught apply equally to duplexes and 1,000-unit complexes.
You will come to understand the risks and income generation/cost savings copportunities inherent in performing a value-add renovation program while continuing to operate the building. This analysis can also apply applies to the acquisition of distressed or foreclosed properties. Includes fully-assembled, fully-unlocked Excel file and hands-on exercises and accompanying solutions.
Topics covered include:
- Integration of historical property data and existing rent roll into your pro-forma
- Modeling of future lease expirations and renewals and the individual unit renovation program
- Modeling of operating expense savings gained from the renovation/greening of apartment units
- Modeling of acquisition loan financing, residual equity requirement, and permanent take-out loan/refinancing
- Constructing amortization tables and using the VLOOKUP function efficiently
- Property Disposition modeling
- Running of sensitivity analyses around key variables in 2-way Data Tables.
The Excel file includes the following tabs:
- Rent Growth Variables
- Assumptions Overview block diagram
- Rent Roll
- Assumptions
- Renovation Timing
- Cash Flow Overview block diagram
- Monthly Cash Flow Exercise
- Amortized Renovated Unit Losses
- Monthly Cash Flow Solution
- Annual Cash Flow
- Amortization Schedule for Acquisition Loan
- Amortization Schedule for Permanent Loan
Office Property Operating Projection and Acquisition Screening Analysis Modeling

In this 90-minute video tutorial, you will learn:
- The typical line item set-up for office properties
- Cash flow projection modeling basics
- How to building a multi-tenant property-level operating projection (also applies to single-tenant properties) assuming initial vacancy that is leased up, and no subsequent expirations during the analysis timeline
- How to conduct a property-level acquisition equity returns screening analysis.
Part 1
First, you will first learn the generic 20-line item set-up for an existing operating commercial office property, starting at Base Rental Revenue (Gross Potential Rent) and ending at Before-Tax Levered Cash Flow (cash flow to equity).
Then, a primer on projection formula construction is provided to get you ready to construct the 10-year annual property operating projection.
Next, the assumptions for projection modeling exercise are explained.
There are three Suites in the property. The assumptions to be used are that leases for Suites 100 and 200 were put in place at the start of the trailing twelve months, and that Suite 300 is vacant currently and will remain vacant through the end of Year 1. Suite 300 rent will commence at the start of Year 2 with Year 2 Base Year.
Suite 100 is a triple-net (NNN) lease, and Suites 200 and 300 are Gross leases (Base Year stop).
The following assumptions inputs are provided for you to key into the Exercise tab:
- Property-level Base Year (BY) operating expenses, real estate taxes and utilities PSF
- Base Year rents for all three suites
- general vacancy and credit loss
- Annual growth rates for rents for all three suites
- % of reimbursable and non-reimbursable expenses that are fixed
- Annual growth rates for:
- parking and miscellaneous revenue
- reimbursable expenses
- real estate taxes
- non-reimbursable expenses
- capital reserves
- Management fees as a % of EGR
- Tenant Improvements and Leasing Commissions PSF for Suite 300
Projection formula mathematical descriptions are provided to guide your Excel formula construction.
After a couple of examples are performed for you, you will fill in the 30+ line items in the exercise. You can check your work in real-time against the fully-unlocked Solution set tab provided in the Excel file. Solutions for the lines are explained in the video.
Part 2
The second part of the tutorial takes the NOI line from the Part 1 Solution set tab, and weaves it into an acquisition analysis screening tab that integrates purchase, sale, debt and equity elements.
The sections of this analysis are:
- Uses of Funds
- Sources of Funds (Sponsor equity, Third Party Investor equity, Senior Acquisition Loan)
- Unlevered Projection Analysis
- Debt Schedule
- Levered Cash Flow
- Sensitivity Tables
- Levered Summary
After a few examples are performed for you, you will model more than 100 rows. You can check your work in real-time against the fully-unlocked Solution set tab provided in the Excel file. Solutions for the lines are explained in the video.
Data tables are used to provide a spectrum of outcome possibilities given simultaneous changes in two key inputs. A levered summary table is also provided to evaluate returns for multiple hold durations side-by-side.
BONUS EXCEL CONTENT INCLUDED! *
- Annual equity joint venture partnership waterfall between Sponsor and Investor
- JV partnership structure: (Equity goes in 10% from Sponsor, 90% from Investor.) All equity gets a Preferred Return of 10%; after Preferred Return is distributed and Equity investment is returned, then the Sponsor gets a 20% promote, and the residual 80% goes to ALL Investors, pro-rata to cash investment.
* Bonus content is annotated only; there is no video tutorial footage associated with it.